AI-Infused Community Reporting
Our reporting tools are designed to transform raw data into polished, professional presentations.

Revolutionizing Reporting with SmartDeck™
My-Take’s reporting platform, powered by SmartDeck™, transforms how researchers turn data into insights. Say goodbye to hours spent manual formatting and hello to impactful, professional reports delivered faster than ever before.
Client-Informed Reports
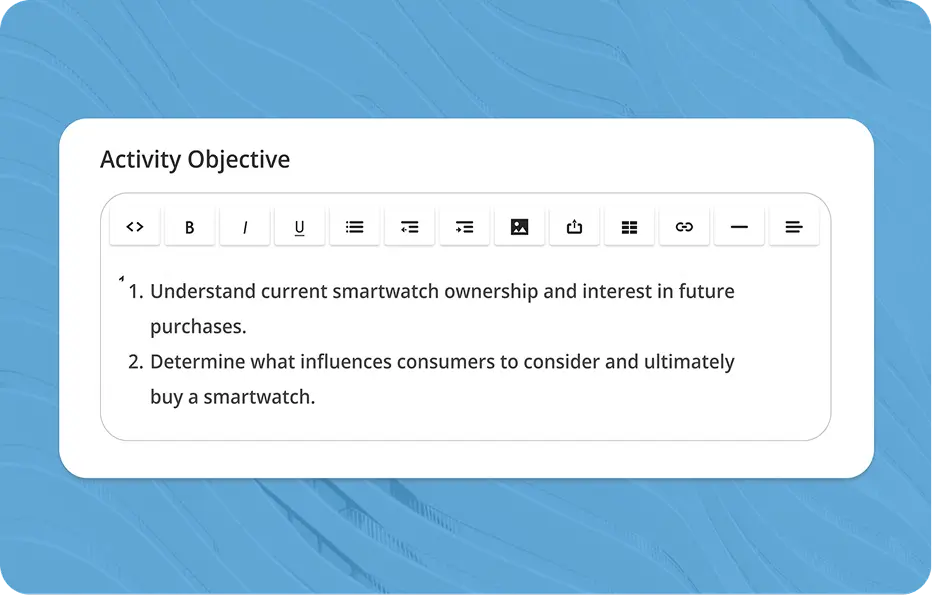
Instantly generate summaries, key insights, and recommendations tailored to your research objectives.
Effortless Presentation Creation
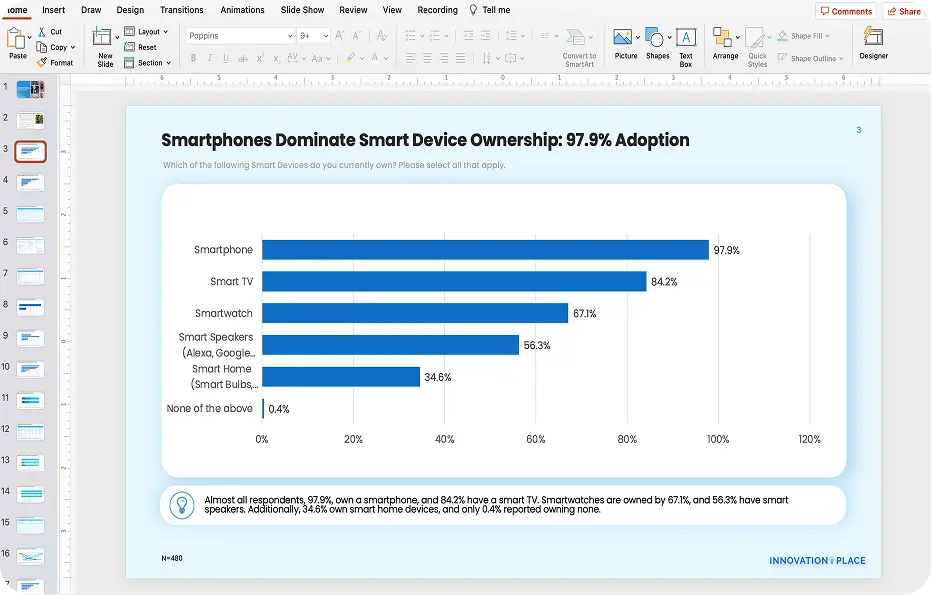
Reports are automatically formatted to your organization’s brand guidelines, including colors, fonts, and preferred chart styles.

Customizable and Flexible
Auto-generated slides are fully editable within the platform. Our AI also allows for custom prompts and revisions.
Key Reporting & Analysis Features
Live Reporting
Live reporting is an incredibly powerful feature of the platform. It allows stakeholders to view results as they happen, and can also be used as a means to see a quick overview of the results and conduct additional analysis.
Findings can also be presented directly from the platform with our intuitive, in-platform presentation mode. Perfect for collaboration or discussing preliminary insights before finalizing your deck.
Data Visualizations
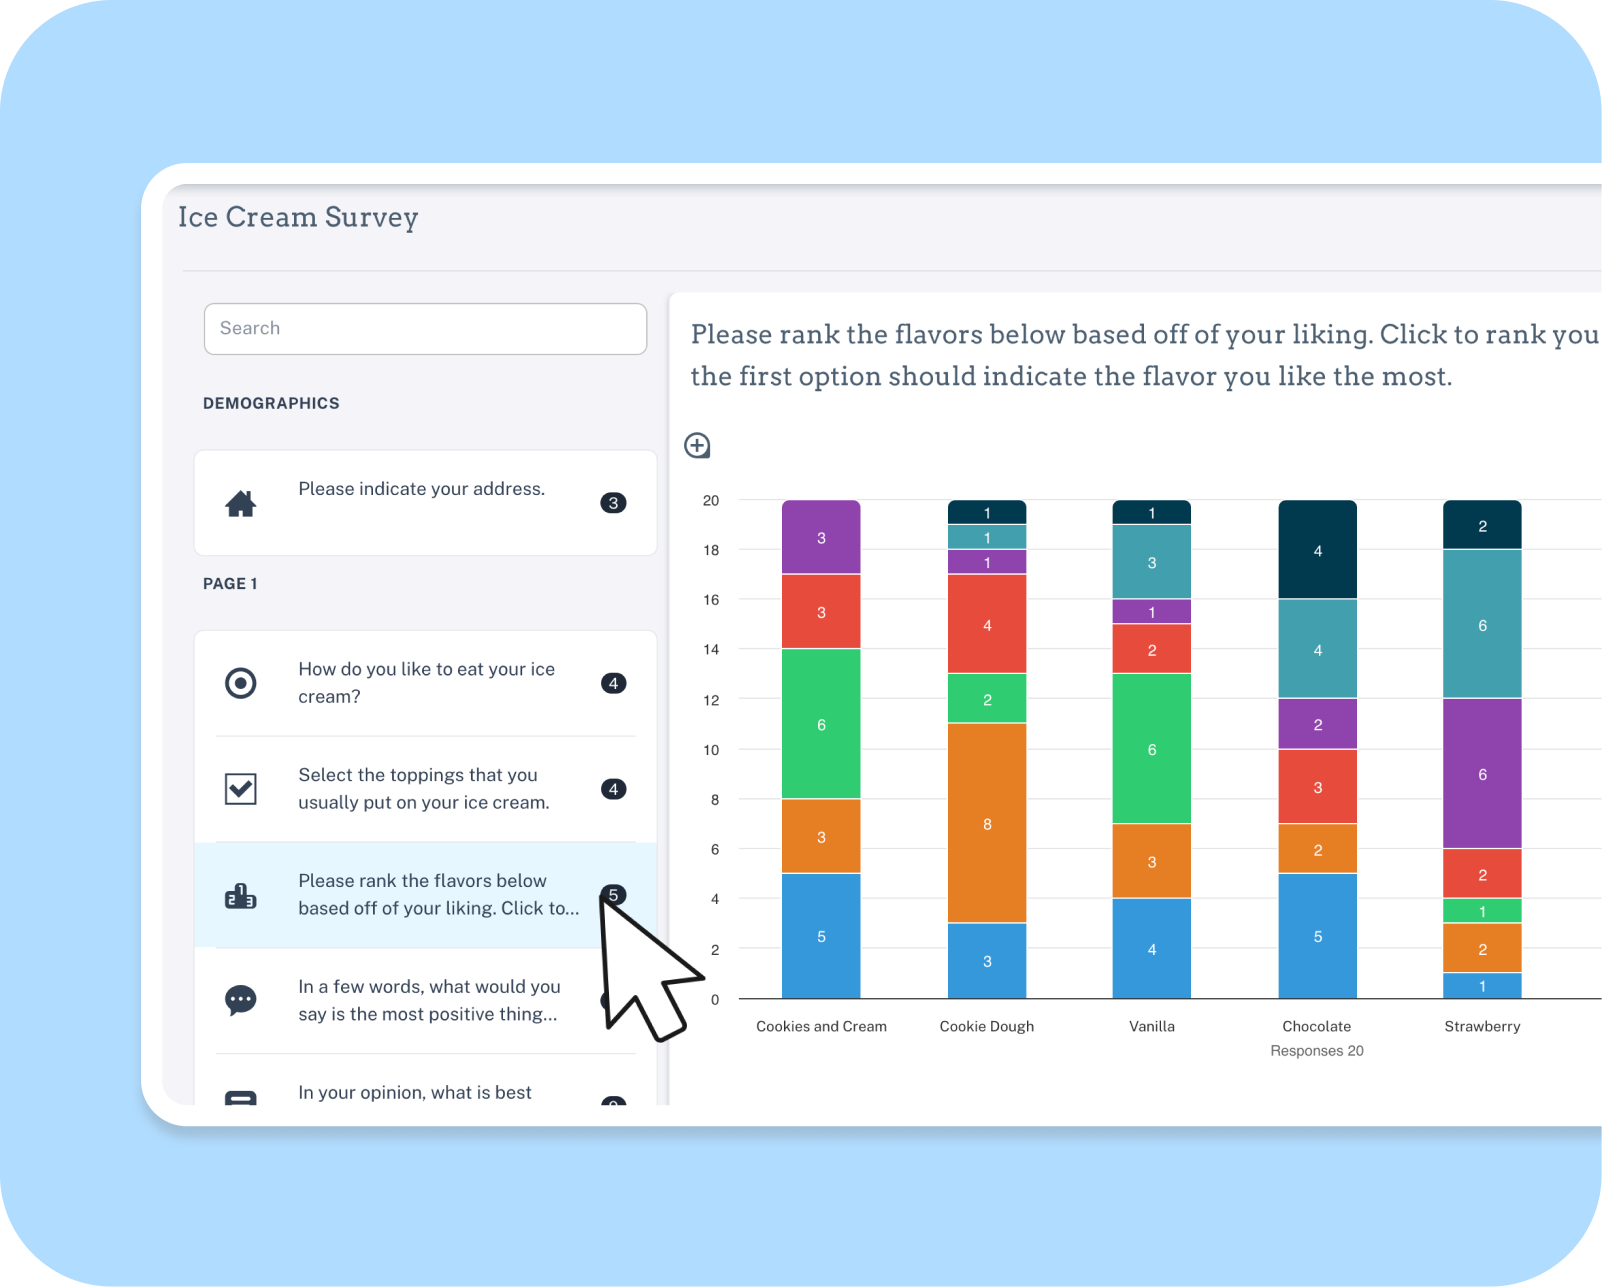
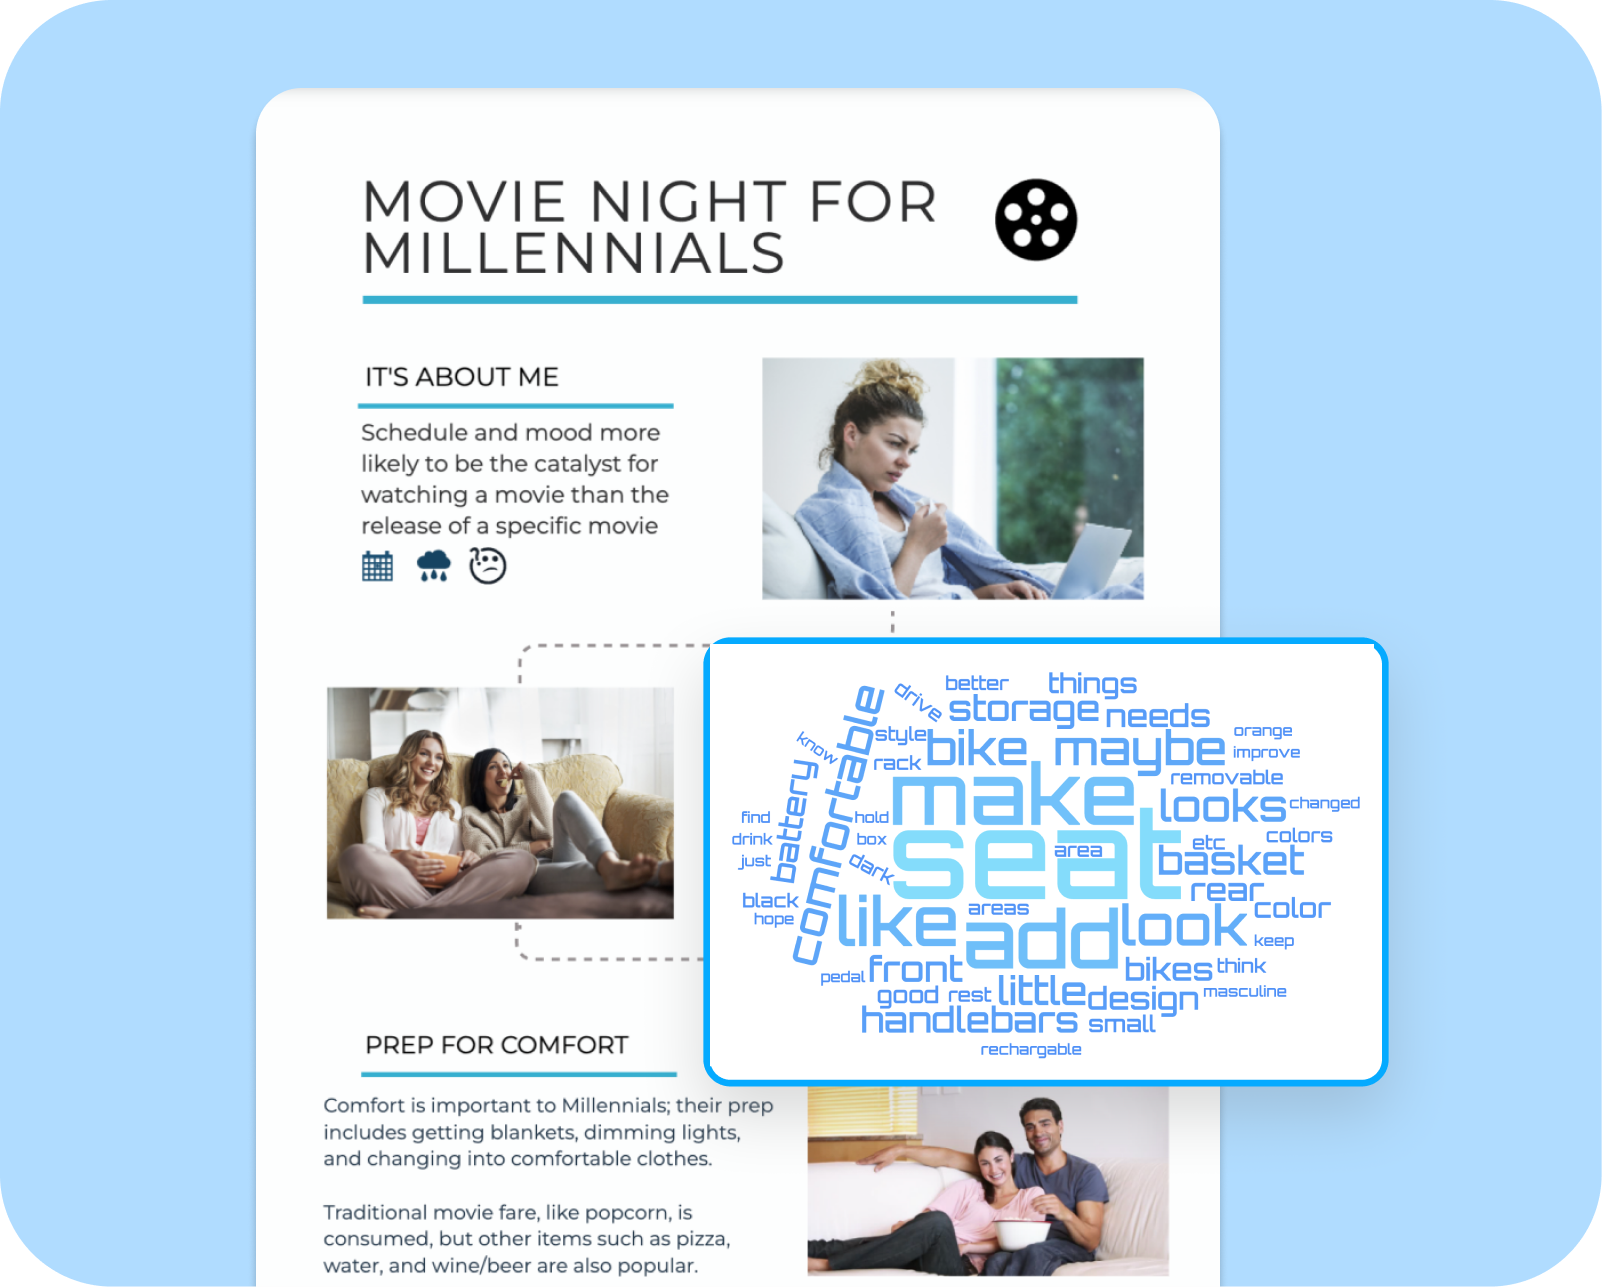
Automatically generated charts, graphs, word clouds, and tables make it easy to turn complex data into clear, compelling visuals ready for presentations.
The platform is also equipped with an infographics builder suite. Clients typically use this feature for communicating select results throughout their organization, or as a means to share select data with community members.
Data Exports
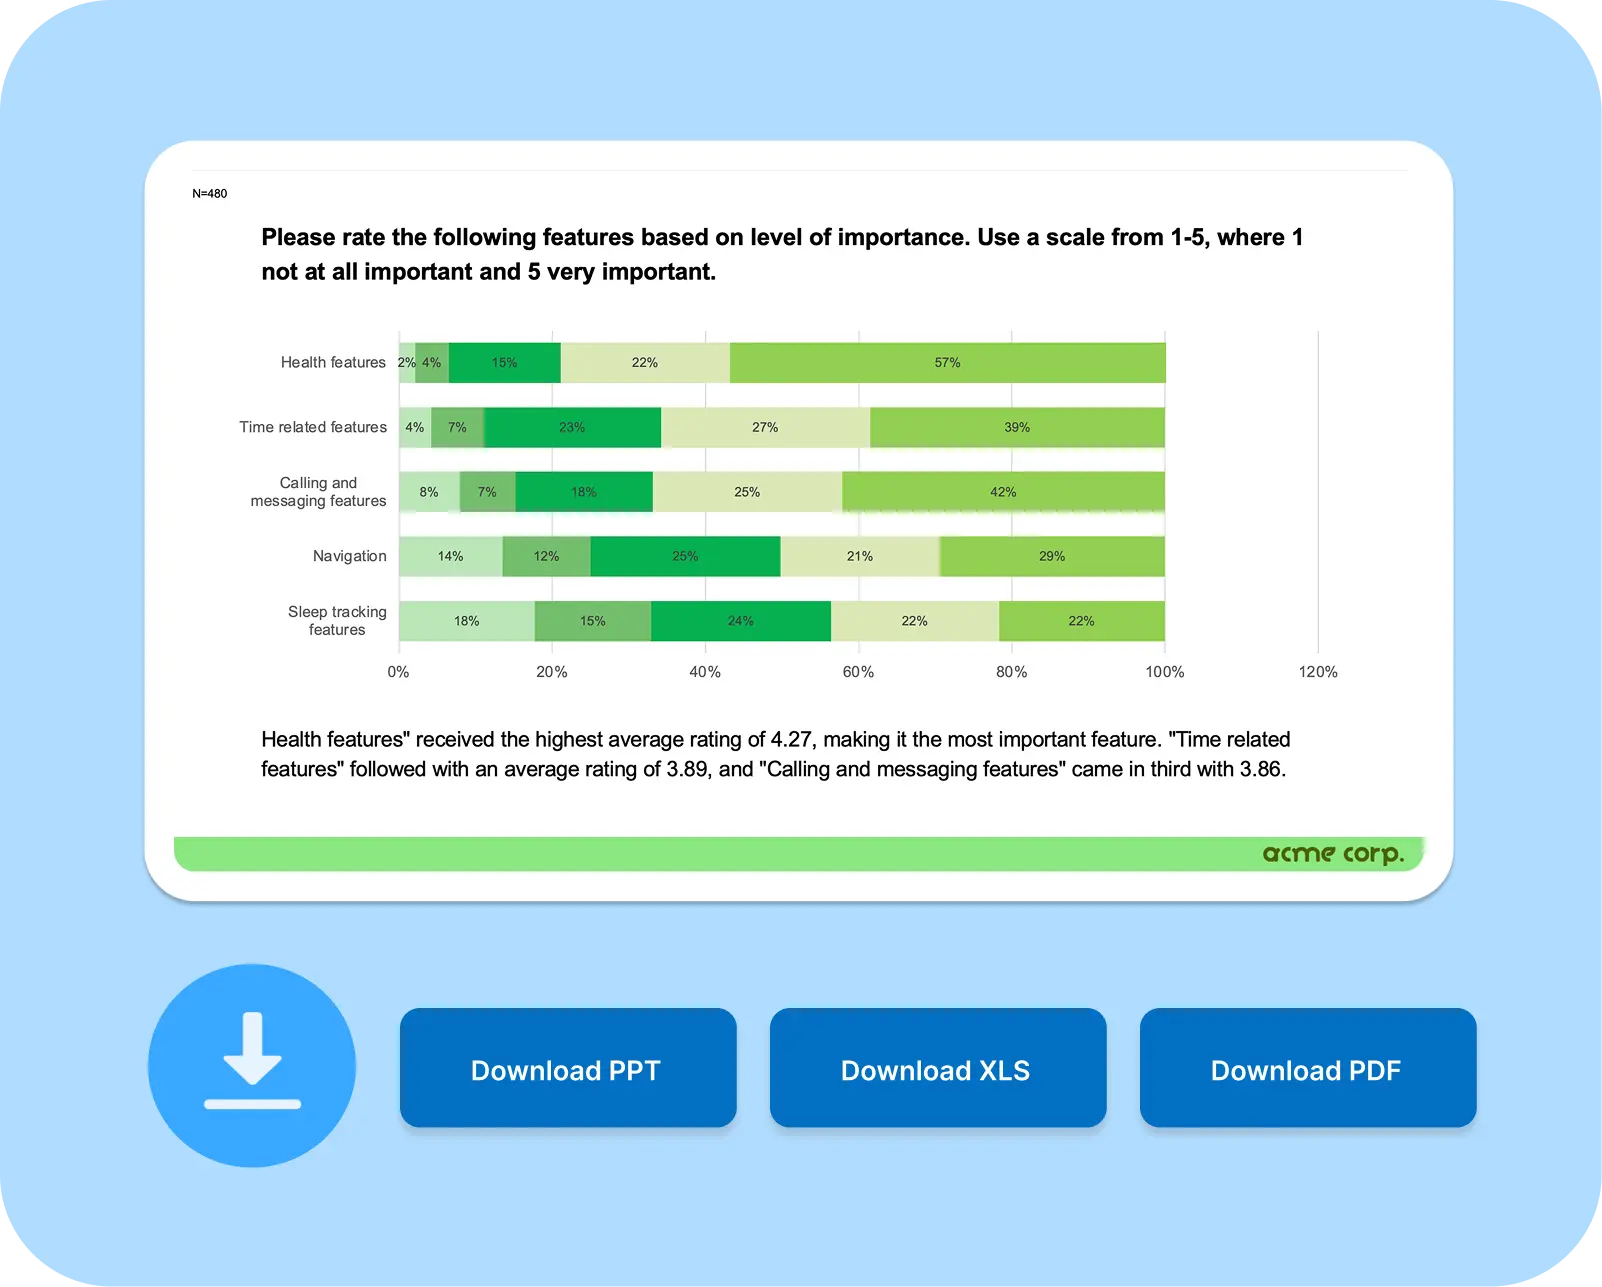
From Excel and PDF, to fully branded PowerPoint slides, the platform has export options to fit your workflow, ensuring your reports are ready to share and impress.
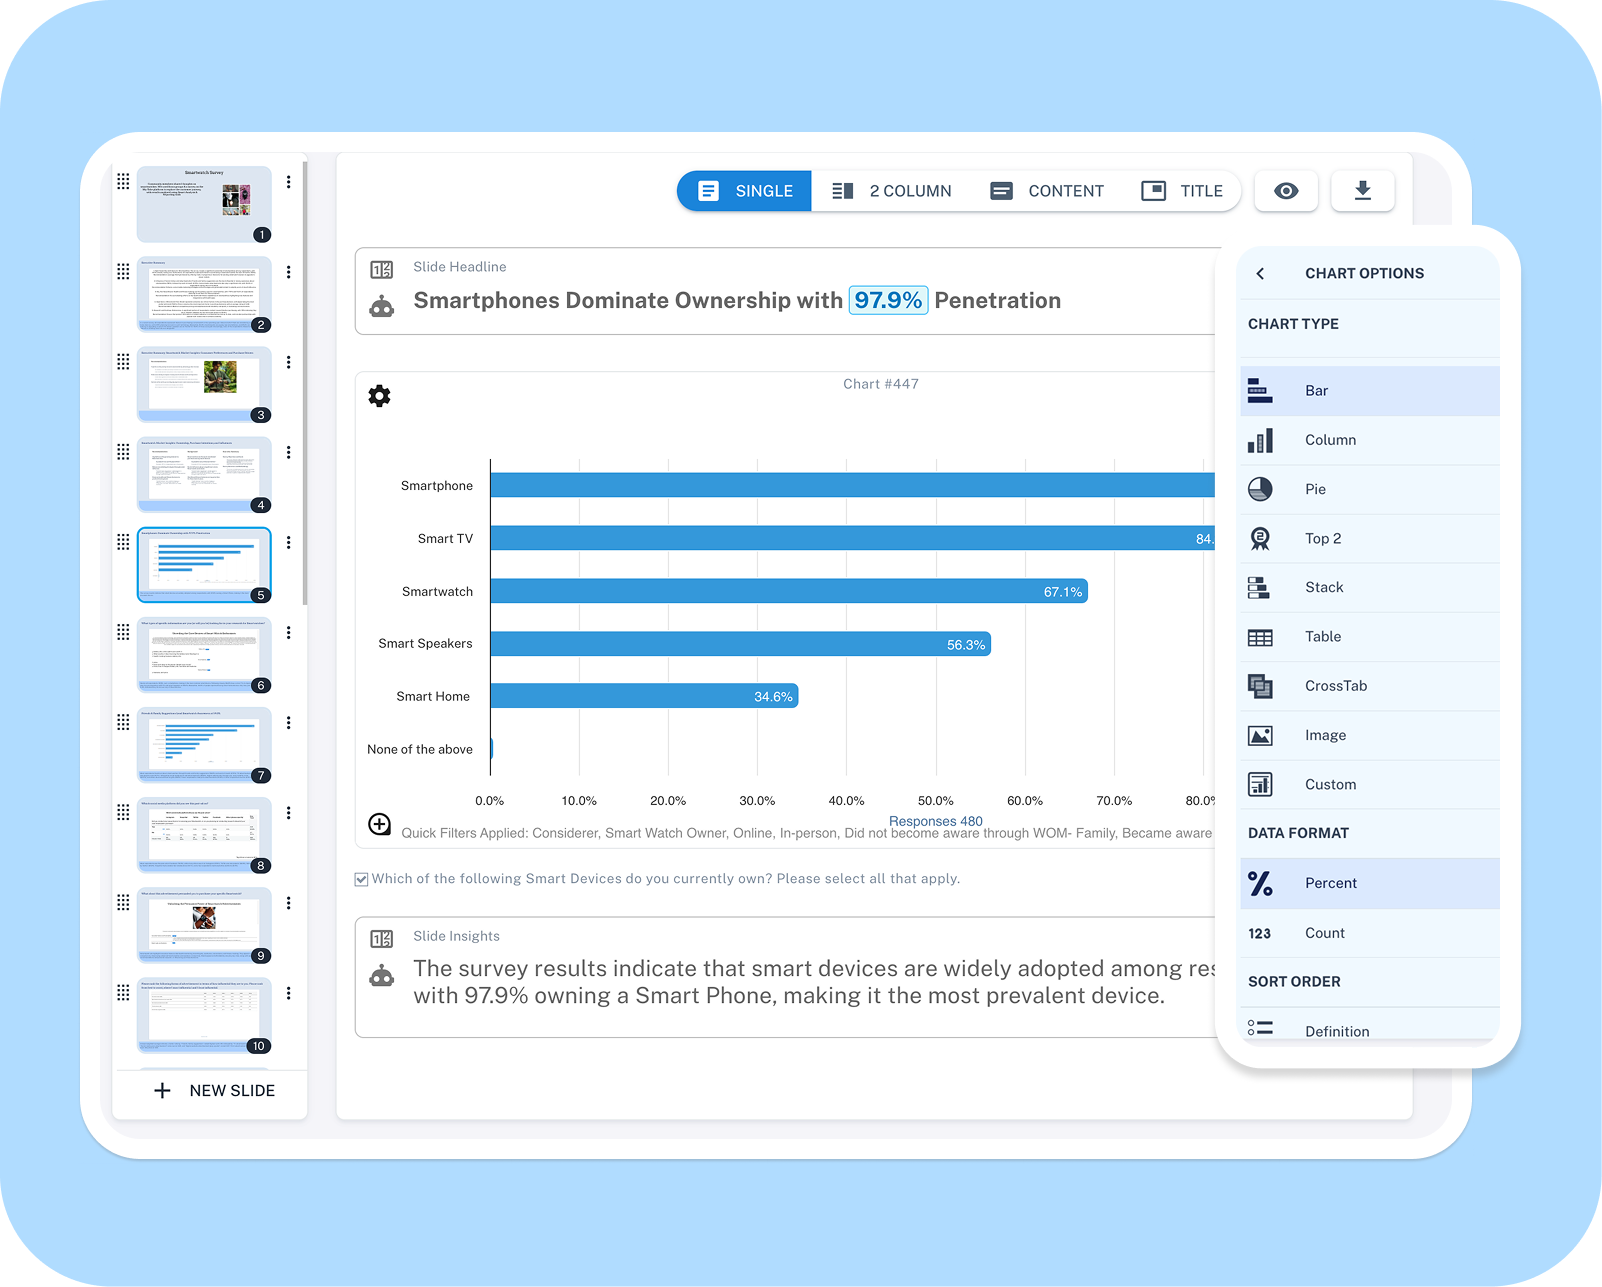
In-Platform Report Editing
Use our intuitive slide editor to refine, organize, and polish your presentation directly within the platform.
Open-End Text Analysis
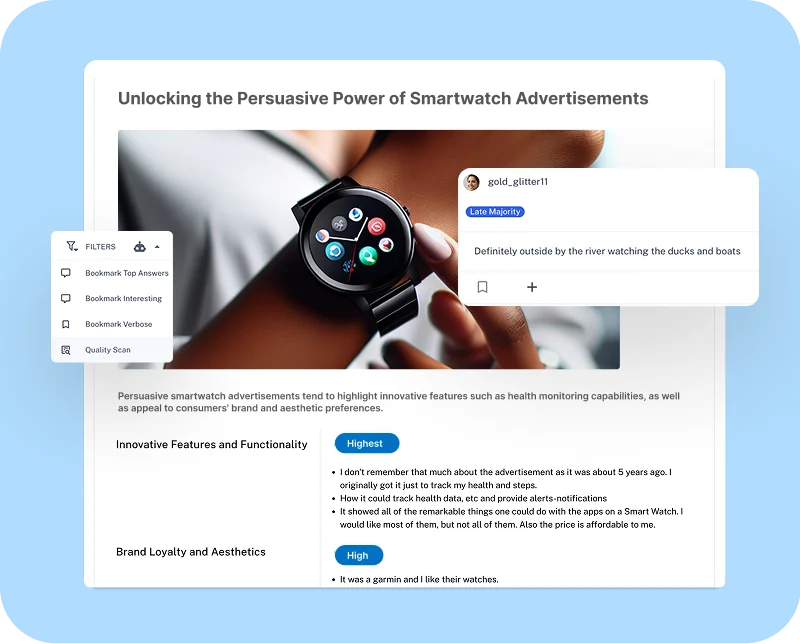
Open-ended responses are categorized and themed with AI Instant Theming, cutting down analysis time while uncovering the most critical insights.
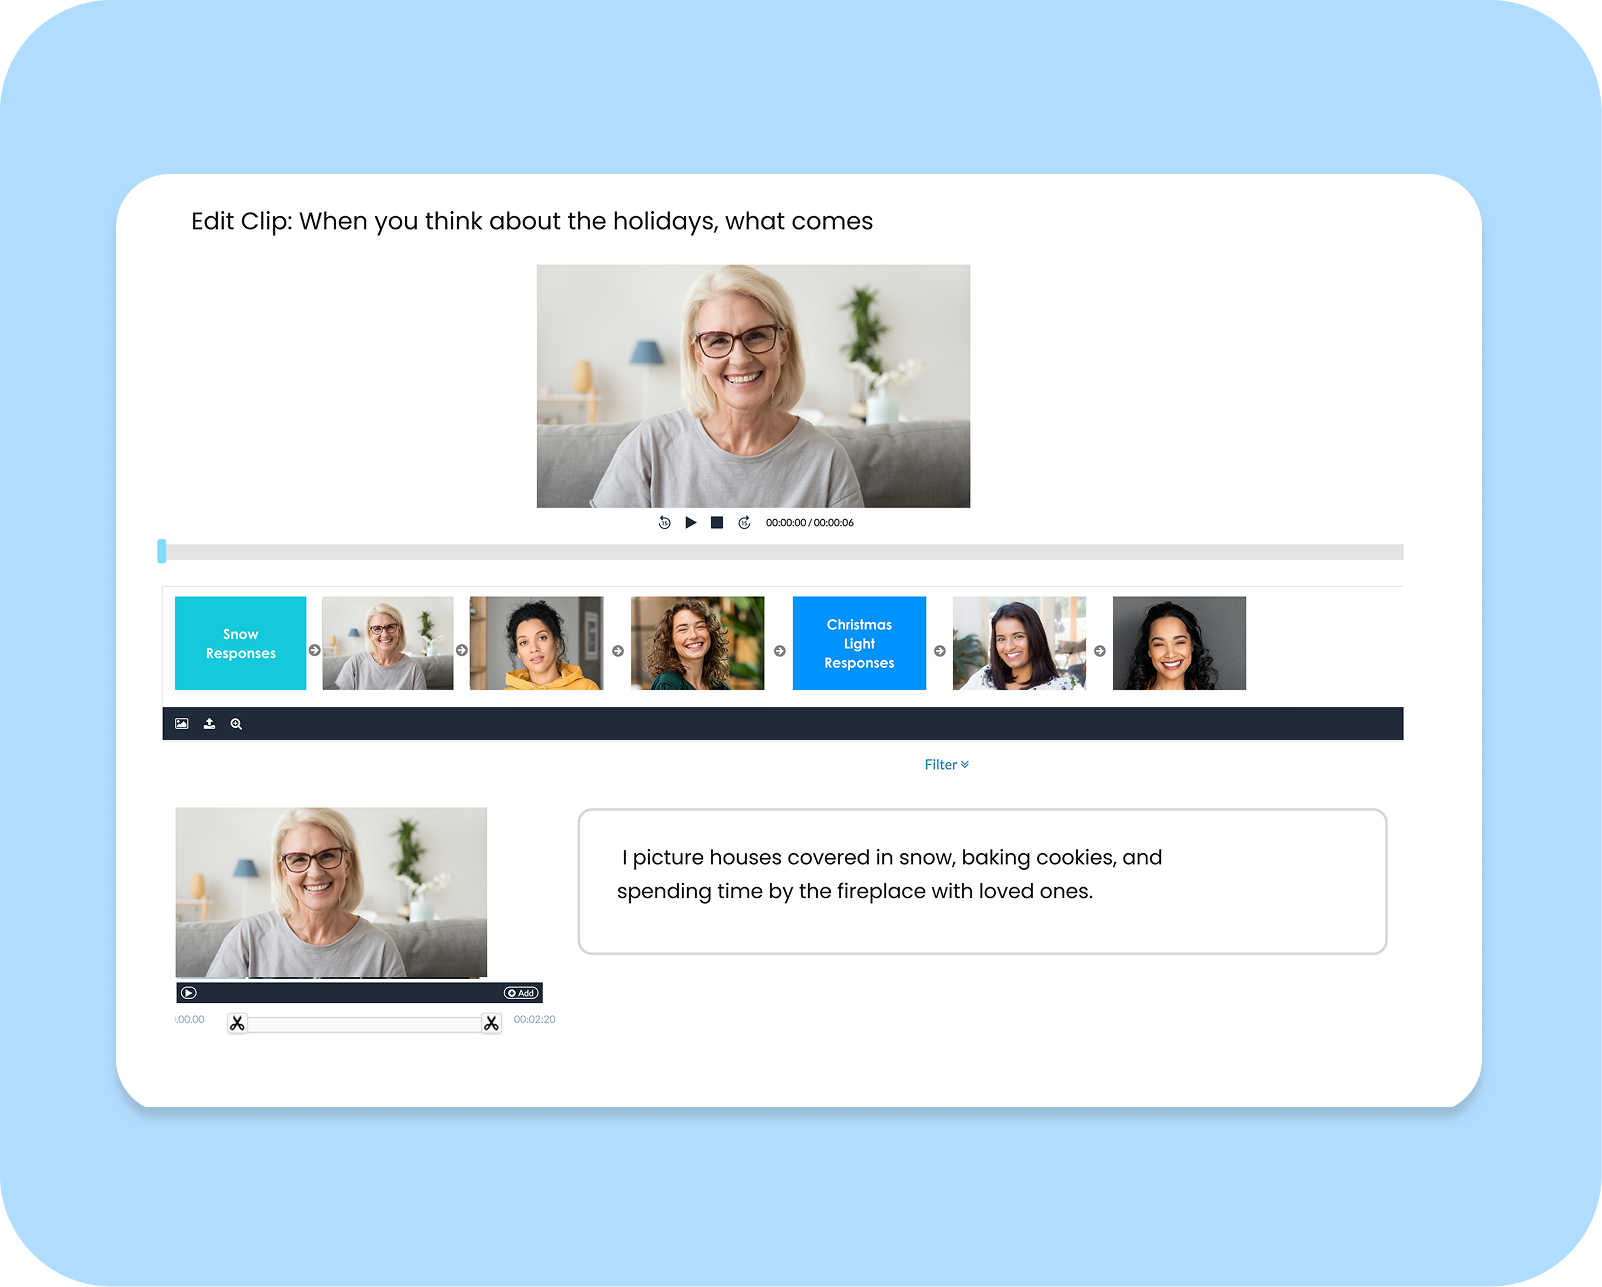
Video Editor
Integrated video editor allows you to create highlight reel montages of your members' multimedia uploads.
Advanced Qual + Quant Analysis Tools
-
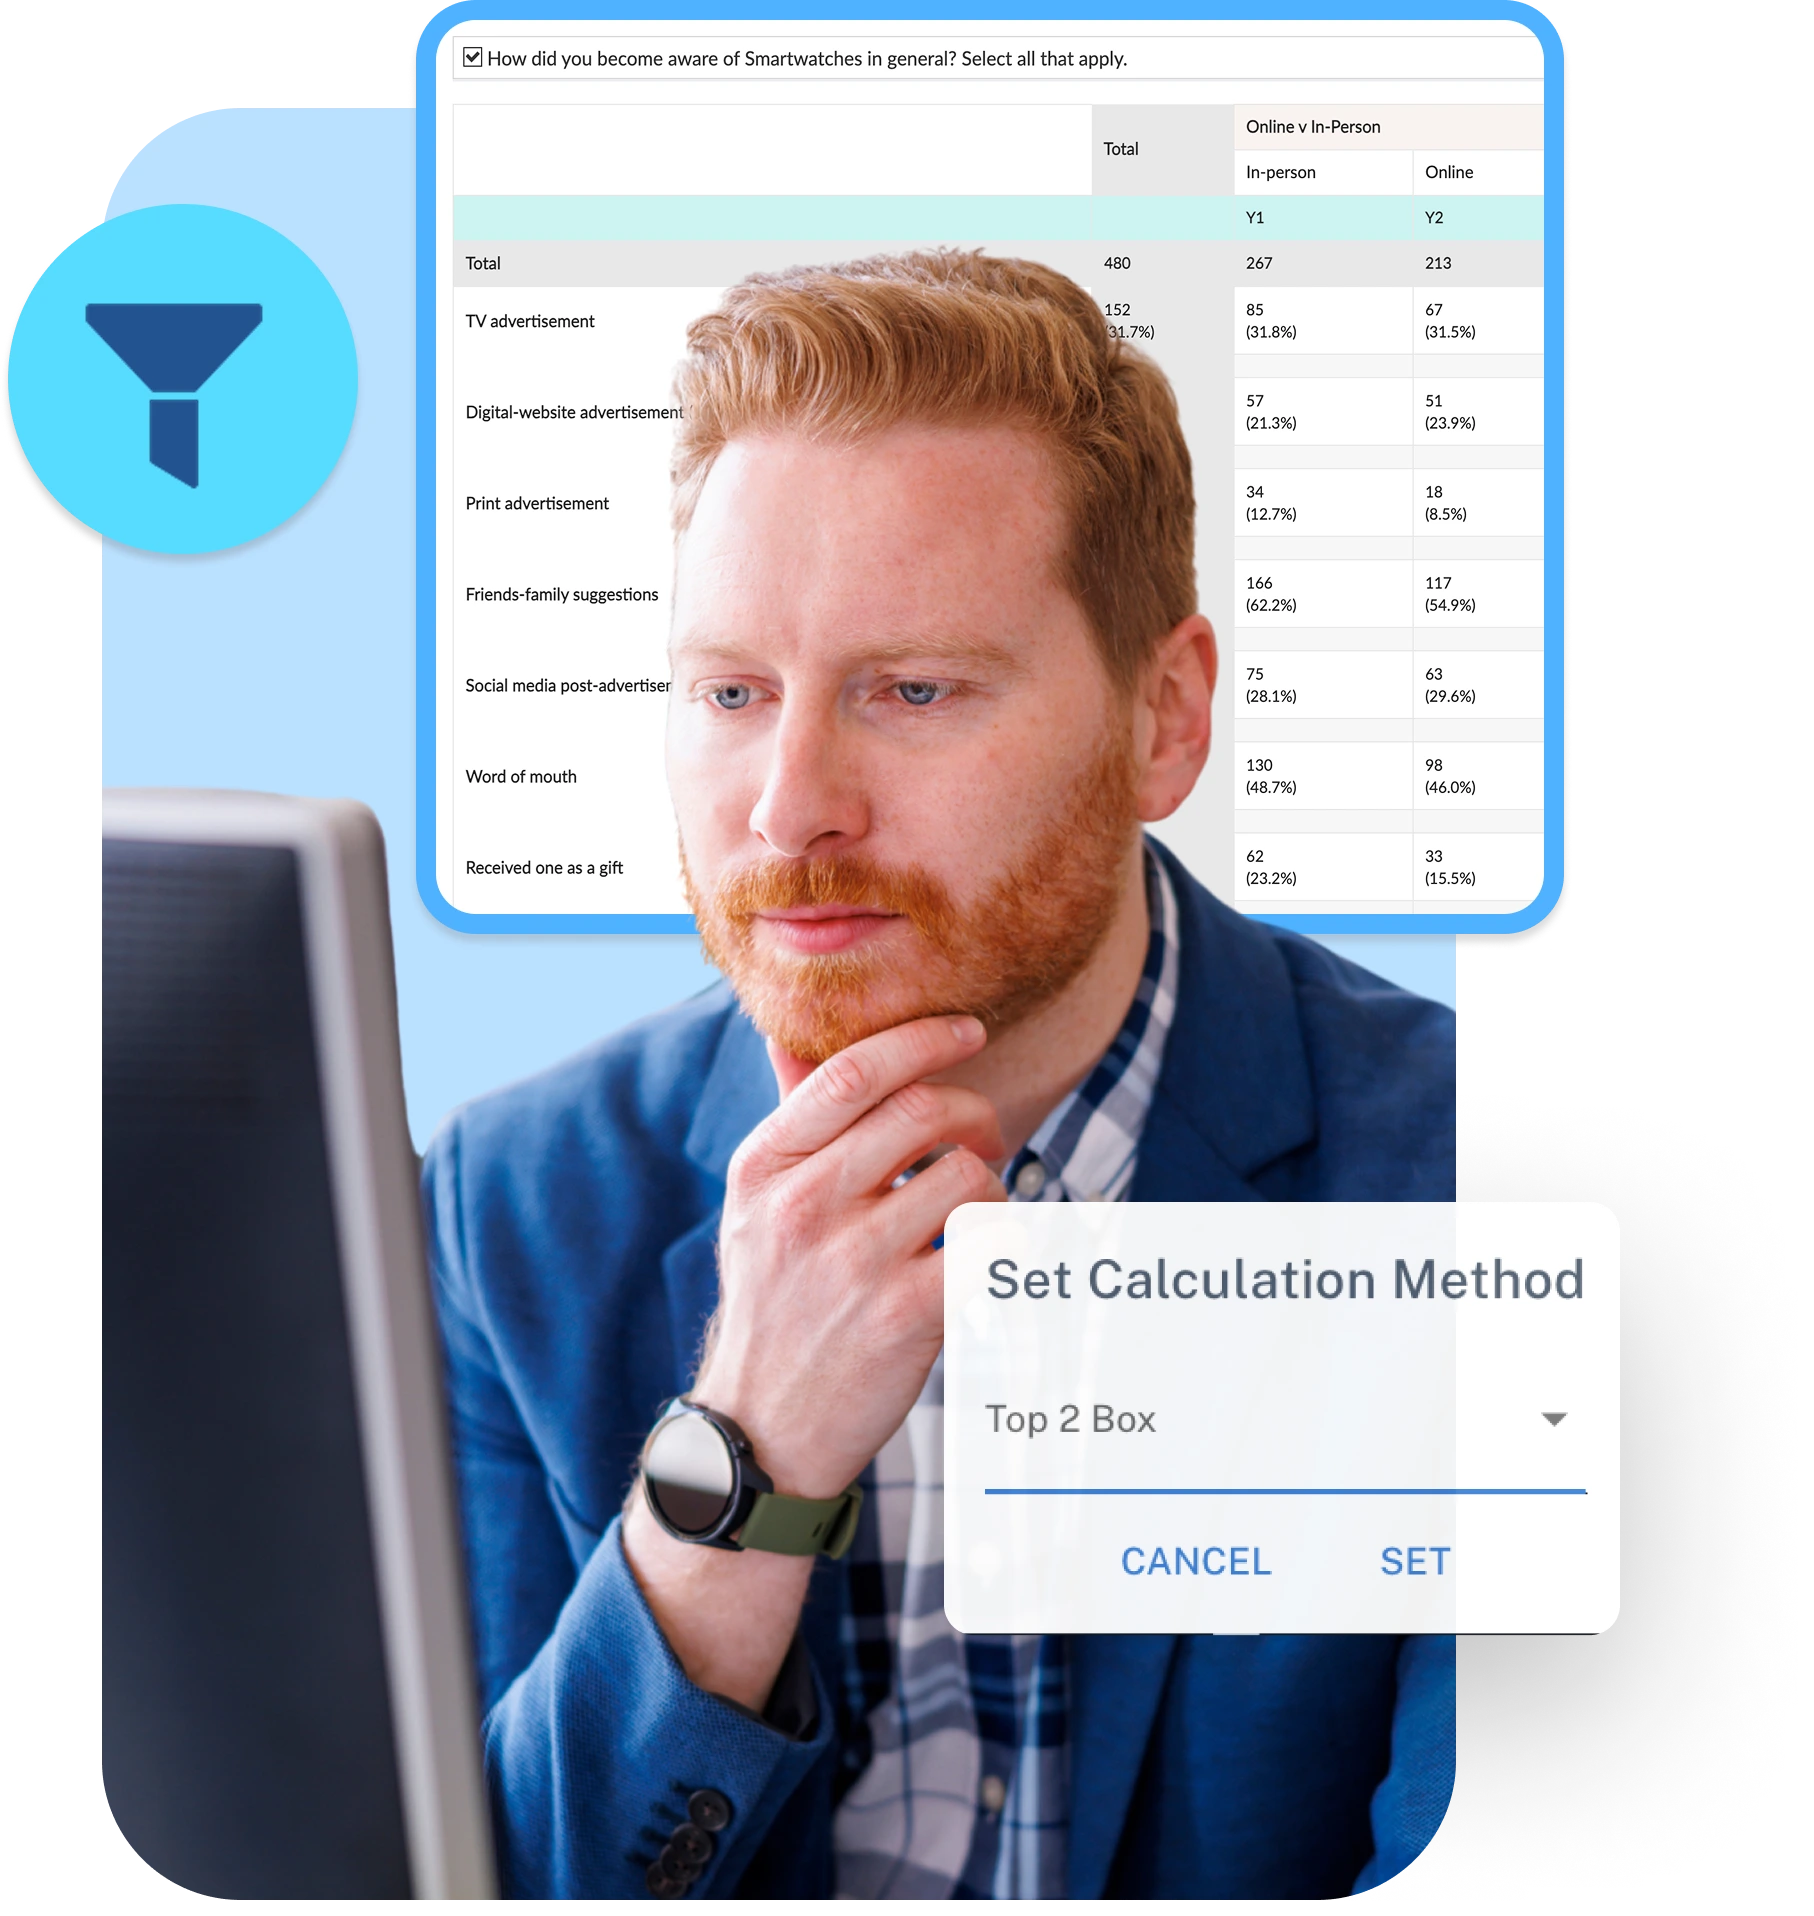
Cross Tabs and Banner Tables
Gain detailed insights with fully integrated cross tabulation capabilities. Easily nest additional questions or demographic data to create formatted banner tables for in-depth analysis.
-
Statistical Testing and TURF
Make confident, data-driven decisions with built-in analytics tools:
-
Statistical Testing: Identify significant differences with confidence levels adjustable to 90%, 95%, or 99%. Analyze correlations to reveal key trends
-
TURF Analysis: Optimize product and service offerings by pinpointing combinations that maximize reach and impact
-
-
Filtering, Sorting, and Anchoring
Tailor your data analysis with flexible options:
-
Filtering: Focus on specific segments or criteria
-
Sorting: Organize results by key metrics or importance
-
Anchoring: Keep essential benchmarks in view for easy comparisons
-